Paolo Bosetti
Home
Blog
About
Recent posts
Categories
All
(14)
DoE
(1)
LaTeX
(1)
R
(13)
TikZ
(1)
algorithms
(2)
bode
(1)
caracas
(1)
clustering
(1)
coding
(1)
ggplot
(2)
math
(1)
measurement
(1)
mixtures
(1)
news
(1)
purrr
(1)
recursion
(1)
statistics
(5)
ternary
(1)
tidyverse
(5)
tips
(5)
Order By
Default
Title
Date - Oldest
Date - Newest
Author
Mixture models
mixtures
ternary
R
DoE
Cornell (2002) describes a mixture experiment in which three components — polyethylene (
x1
), polystyrene (
x2
), and polypropylene (
x3
) — were blended to form fiber that will…
2025-Jan-30
Paolo Bosetti
Symbolic math in R with caracas
R
math
caracas
I want to disclose some nice feature of
caracas
, a computer algebra system for R, which is actually a NumPy wrapper, although it provides an arguably nicer and more elegant…
2025-Jan-08
Paolo Bosetti
Logarithmic scales in GGplot
ggplot
R
bode
Recently I had to port in R some Matlab code using the
tf
and
bode
functions, which are respectively used to calculate the transfer function and create a Bode plot of it.
2025-Jan-07
Paolo Bosetti
Rank-Order Clustering
R
algorithms
Oftentimes, a process can be described by an
incidence matrix
: a logical matrix that shows the relationship between two classes of objects.
2024-Dec-18
Paolo Bosetti
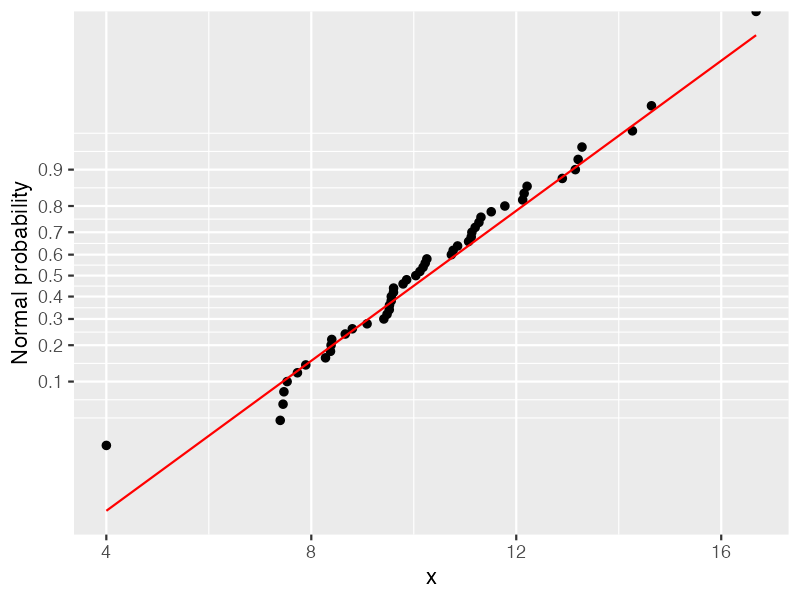
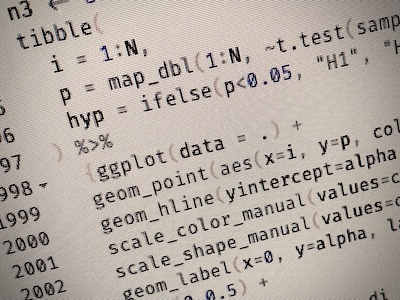
Normality plot
statistics
R
ggplot
One of the most common graphical techniques for checking the normality of a sample is the quantile-quantile (or Q-Q) plot. It plots a scatter of the sample quantiles versus…
2024-Nov-27
Paolo Bosetti
Recurring Satistics
statistics
algorithms
recursion
R
This memo reports the calculation scheme that can be adopted for calculating sample mean and variance statistics by using a pair of recurrence formulas. This approach comes…
2024-Nov-22
Paolo Bosetti
Linearity of an instrument
measurement
R
Recently, I had to explain how to evaluate the linearity of an instrument, defined as its maximum deviation from a purely linear relationship between input (the measurand)…
2024-Nov-11
Paolo Bosetti
Clustering with DBSCAN
tips
clustering
purrr
R
In this post we will show how to cluster a dataset using the DBSCAN algorithm. We will use the
dbscan
package, which is a very efficient implementation of the algorithm.
2024-Oct-31
Paolo Bosetti
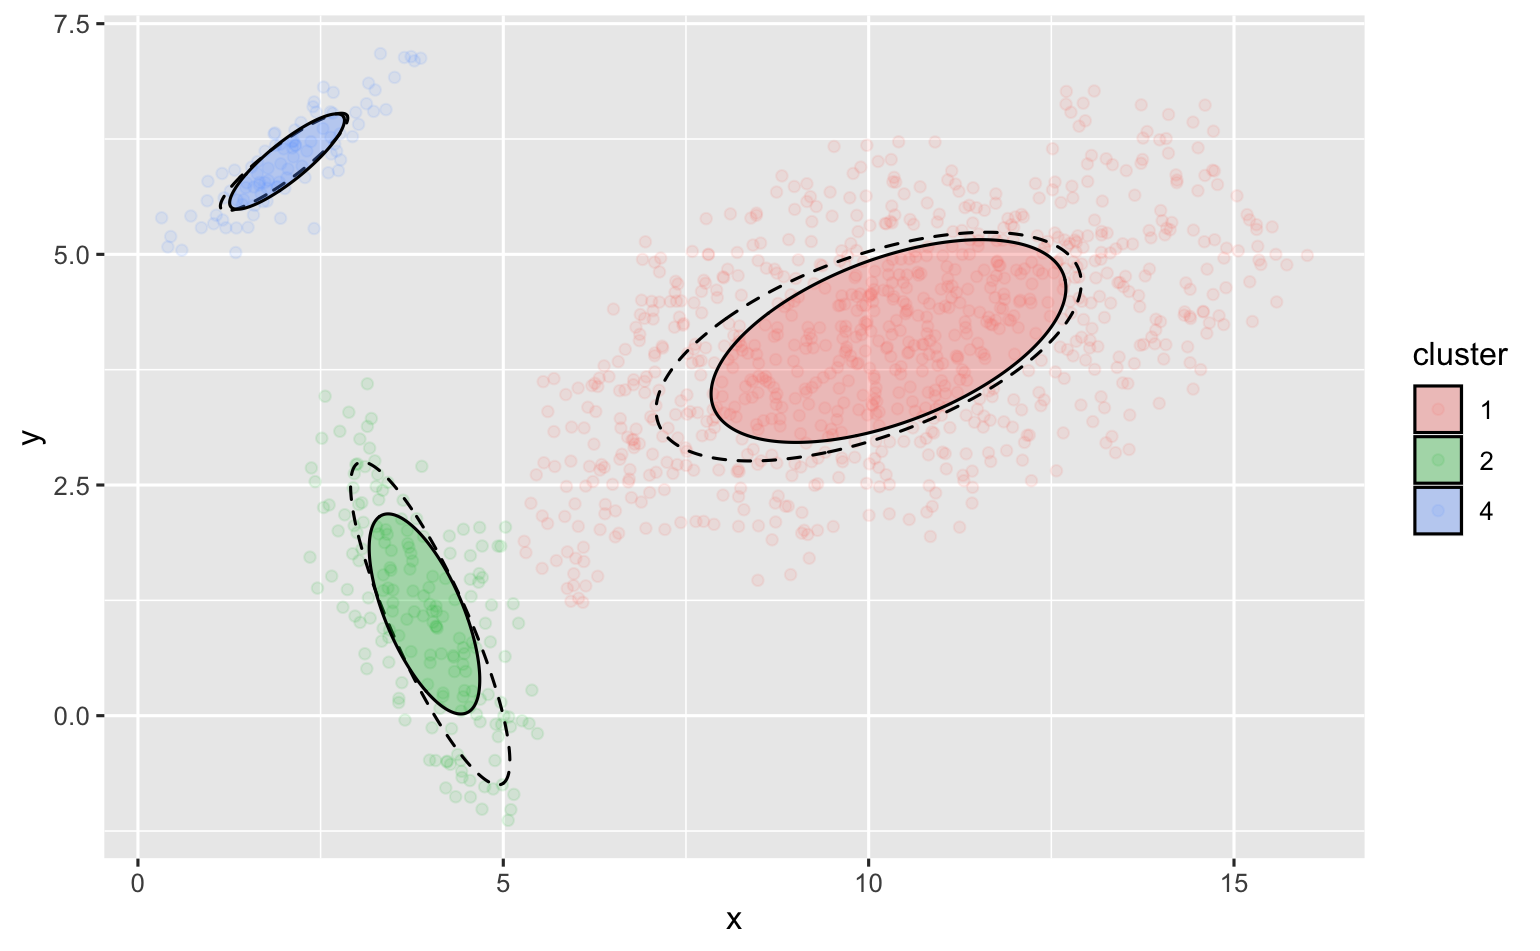
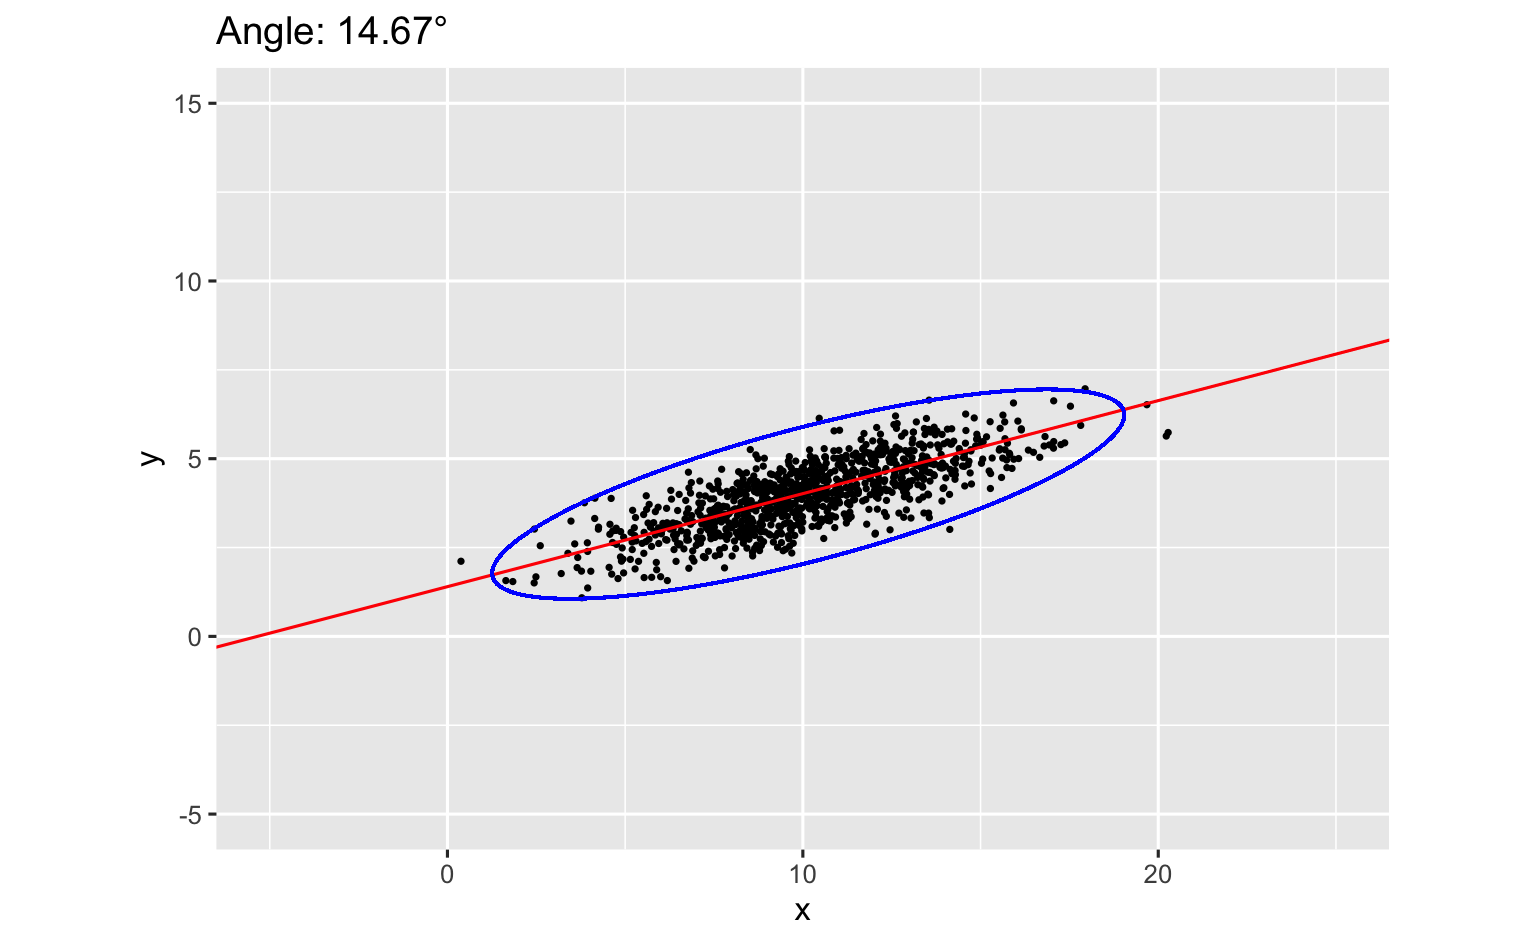
Multivariate Covariance
tips
tidyverse
R
statistics
Multivariate distributions are the multi-dimensional equivalent to common distributions. The univariate normal distribution
\(\mathcal{N}(\mu, \sigma)\)
, for example, has a…
2024-Oct-30
Paolo Bosetti
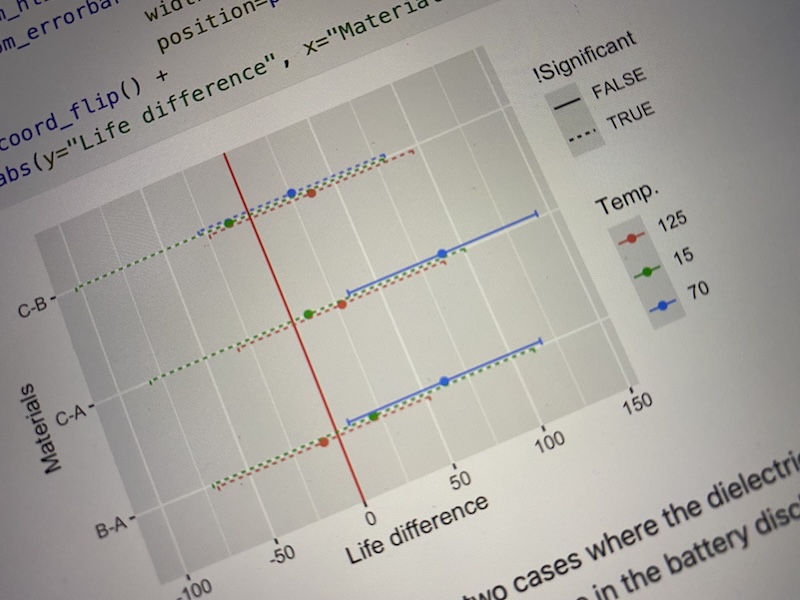
Tukey’s plots
tips
tidyverse
R
statistics
See this previous post for more on plotting Tukey’s tests with GGplot2.
2024-Oct-18
Paolo Bosetti
TiKz and GGplot2
tips
tidyverse
R
LaTeX
TikZ
RMarkdown and Quarto notebooks can create beautiful documents via knitr and LaTeX, we know that. But we can do even better: we can use TikZ to create plots that are…
2024-Oct-11
Paolo Bosetti
Tukey’s test
tips
tidyverse
R
statistics
The Tukey’s test is a very useful statistical test to compare the means of different samples. It is a multi-sample version of the Student’s T-test.
2024-Sep-26
Paolo Bosetti
Passing dot to ggplot2
coding
R
tidyverse
I’m starting with a little lifesaver of a trick that I recently learned on hot to reuse the input data in a ggplot2 call.
2024-Sep-24
Paolo Bosetti
Welcome!
news
First post here. I plan to add some R, C, C++ code snippets and some other stuff. Stay tuned!
2024-Sep-23
Paolo Bosetti
No matching items